The app marketing space is hugely competitive, and at the same time, data privacy has become the defining challenge for marketers. From Apple’s App Tracking Transparency (ATT) to Google’s Privacy Sandbox, user-level tracking is harder than ever. To stay competitive, you need partners that give you visibility while keeping you compliant. Among these, one of your most important allies is your Mobile Measurement Partner (MMP). MMPS play a central role in any app’s marketing strategy, both for user acquisition and retention.
Key Takeaways
MMPs unify your data: They consolidate insights across paid, owned, and earned channels in one dashboard.
True performance visibility: Go beyond just installs by tracking cost per impression, click, install, and deeper engagement metrics.
Better budget allocation: Identify which channels deliver real value and optimise spend accordingly.
Unlock user insights: In-app event tracking shows not just where users come from, but what they do after downloading.
Essential for privacy-first marketing: MMPs help navigate iOS privacy changes and ensure accurate measurement.
Stay scalable: They simplify your tech stack, replacing multiple SDKs with a single, integrated solution.
What is an MMP?
App marketers typically run user acquisition (UA) campaigns across multiple platforms and channels, including:
Paid – Meta, Google, Snapchat, TikTok, Apple Search Ads, etc.
Owned – Website, blog, email
Earned – App reviews in independent magazines and review sites
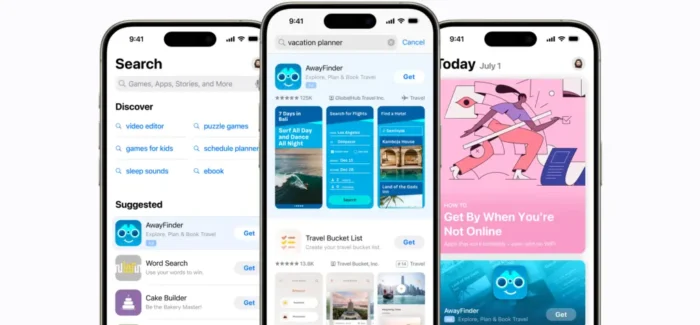
Source: Apple Search Ads
All this activity should lead to people downloading and installing your app, all of which is great, but also meaningless if you can’t track which activity generated each download. And in today’s privacy-first ecosystem, that visibility is harder to achieve than ever. With Apple and Google limiting user-level tracking, attribution can feel like a black-box.
An MMP helps you cut through the complexity by attributing, collecting, and organizing app data in a privacy-first way, delivering a unified view of campaign performance across channels, media sources, and ad networks. It gives you this visibility of which channels are performing, and which aren’t.
For each channel, it will deliver metrics such as:
Cost per impression
Cost per click
Cost per install
Cost per acquisition
These insights enable you to optimise your marketing spend towards the best-performing channels so that you can scale up your UA activities most efficiently. This is particularly important when you consider that app user acquisition costs have increased by 60% in the last five years, reaching an average of $29 per user in 2024, according to research from SimplicityDX, reported by Business of Apps. Understanding where your budget delivers the best results is essential for staying competitive.
But it doesn’t stop at downloads. The data MMPs generate enables you to dig deeper into the value of each install by looking at what happens “down-funnel” by setting up in-app events.
Use In-App Events to Generate Valuable Insights from your MMP
In-app events allow you to track what users do in the app after installing it. Each event is a key conversion point in the user’s journey through the app. They will differ depending on the type of app, but will typically include things like:
User registration
Newsletter sign up
Clicks on a push notification
Makes a purchase
Join your loyalty program
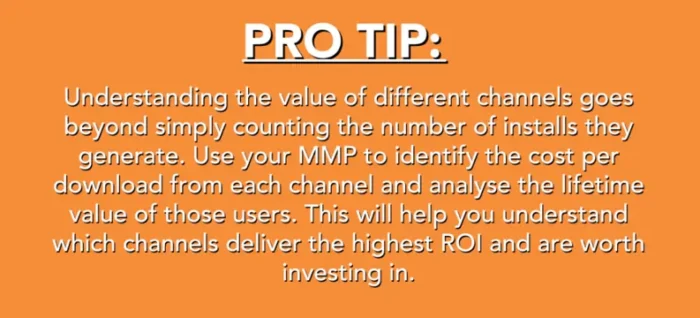
You can set up the in-app events that are most relevant to your app and most useful in understanding the value of each user. Your MMP then enables you to track these back to where the install came from. This might reveal, for example, that Meta generates twice as many installs as Apple Search Ads, but that the users who install after clicking on an Apple Search Ads spend three times more in the app than those who came in via Meta.
Simplified Reporting in one Dashboard
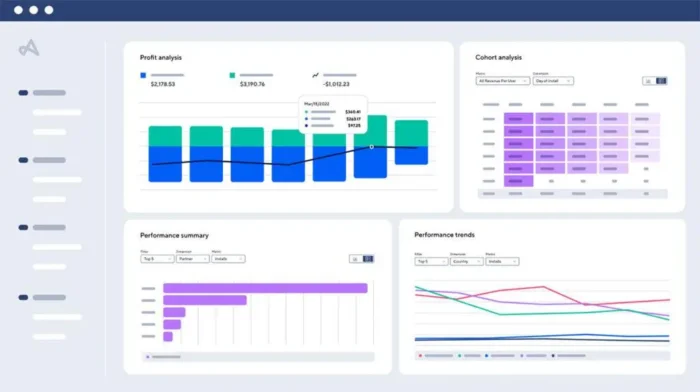
An MMPdelivers all these insights in one unified dashboard, across all the platforms you use to find new users. It’s a far easier way to get a consolidated, real-time view of what’s happening. Even if you’re only active in one or two channels, the insights an MMP delivers into things like Customer Lifetime Value, churn, and conversion against the in-app events you set up far exceed what each platform will typically offer in terms of reporting.
The Benefits of Using an MMP
In summary, the key benefits of using an MMP are:
Unified reporting across all platforms in one dashboard
Granular insights into cost per impression/click/install, customer lifetime value, churn, conversion in in-app events
Insights that enable you to optimise your marketing spend and better allocate your budget.
Why Skipping an MMP is a Risky Move
Falling Behind in Privacy Compliance With iOS privacy updates transforming the landscape, MMPs are critical for adapting to new tracking systems and ensuring accurate data collection. They provide the agility needed to stay ahead in a rapidly changing privacy environment.
Misleading Performance Data Without an MMP, you’re forced to rely on self-attribution from platforms like Google, which often overinflate their numbers. We’ve seen examples of platforms over-reporting key metrics like installs, leading to inaccurate performance insights. This kind of misreporting can lead to budget misallocation and misguided strategy decisions.
Missing out on Critical Insights MMPs allow you to measure and optimise performance beyond just installs, providing a more comprehensive view of user behavior and value. Leveraging MMP data can reveal that a lower CPI doesn’t always translate to higher-quality users. By analyzing the relationship between CPI and downstream metrics like trial start rates, marketers can refine their bidding strategies to drive better results. Without an MMP, such nuanced insights, and the resulting optimizations, wouldn’t have been possible.
Overcomplicating your Tech Stack Skipping an MMP requires integrating multiple SDKs, such as Meta, which not only complicates the setup but also raises significant data and privacy concerns.
Setting up your MMP for Success: Best Practices
Most of the main MMP providers will have integrations across your tech stack, but this is a point worth checking with them when you are assessing providers. If the MMP is integrated across your tech stack, it will be easier to set everything up and gain the insights that will feed your app’s success. For example, if you have already set up in-app events in an in-app analytics tool such as Mixpanel, these can be carried across to the MMP platform to avoid duplicating effort.
1. Define the In-App Events to Optimize Towards
The first step to maximizing the investment in your MMP is to define the in-app events you want to track.The chosen events should reflect meaningful interactions that signal user engagement or progression toward higher-value actions. It’s vital to define these events, not only to monitor when and how frequently they occur, but also to optimise your user acquisition campaigns to align with each funnel stage. Once the user completes an event, i.e.., installs or registers, the point of optimization within the campaigns may change to encouraging conversion to purchase, for example.
2. How many In-App Events should I Track?
It’s not possible, or even desirable, to track everything that happens in your app. We normally recommend around 5-10 in-app events. These should be the key points you want users to convert against, and the ones you can optimise your campaigns towards. Events should describe an action a user takes and should be a combination of a verb and noun, for example:
Registration Completed
Watched Video
Product Page Viewed
Purchase Completed
Subscription Purchase Completed
Event names should be easy to read and not overly descriptive. Upper/lower casing is supported, and it is recommended that the verb should be in the past tense (see the example below).
Once you have defined the in-app events, create a tracking plan that details the naming convention for each event (e.g. subscription purchase completed); the point where it triggers (once a user selects the ‘confirm payment’ button on the billing page); and any parameters that provide more detail on that event (e.g., ‘monthly’, signaling that it is the monthly subscription they’ve purchased), then pass that onto your developers to in build as part of the SDK setup. Now you’re ready for testing.
3. Test Everything to Ensure Success
Testing is vital to ensure that your app behaves as it should and that the in-app events are triggered correctly. Once the in-app events are set up, set up an app testing account to simulate the potential user journey and ensure the events show within the MMP testing environment. Use this account to complete each in-app event, ensuring that:
The events are triggered at the appropriate points
The tracking is functioning properly
The data returned is accurate and reliable.
How to Choose the Right MMP to Boost your App’s Growth
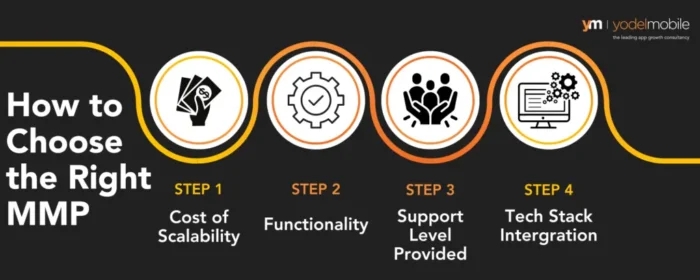
Choosing the right MMP to work with is all about finding one that is best aligned with your needs and expectations. Choosing the best mobile attribution platform is a detailed process, but essentially this breaks down into four key areas:
Cost and scalability – When allocating your budget for an MMP, you need to look at the bigger picture. As you expand your marketing efforts using an MMP, the associated costs are likely to rise, not just from increased spending on channels but also due to the higher volume of reported conversions within the platform. Remember to evaluate these costs and ensure they remain within your budget as your campaigns grow.
Functionality – Ask yourself, does the MMP do everything you need it to do? For example, does it provide a holistic view across multiple traffic sources and in terms of the granularity of data you require to understand each channel’s performance? Or, can it show you how much it’s costing you to acquire a click and a conversion?
Support level provided – Are you looking/able to run everything on the MMP platform yourself, or do you need the support of a managed service? Consider the level of support the MMP offers, especially for troubleshooting setup challenges or addressing questions about the data displayed in the platform.
Tech stack integration – Consider what level of integration the MMP offers with your existing tech stack, including in-app analytics tools, CRM tools, and DMPs (Data Management Platforms), and any other tools that you rely on to market and sustain your app.
Final Word: Making the Smart Choice
Even the best app needs a constant influx of new users to replace those who churn and deeper engagement with loyal users. Your MMP is key to achieving this, offering a unified view of marketing performance across platforms. It reveals how many installs each platform drives, their cost, and long-term value. Without an MMP, you’re marketing blind as ASO’s future rapidly evolves.
The app marketing space is hugely competitive, and at the same time, data privacy has become the defining challenge for marketers. From Apple’s App Tracking Transparency (ATT) to Google’s Privacy Sandbox, user-level tracking is harder than ever. To stay competitive, you need partners that give you visibility while keeping you compliant. Among these, one of your most important allies is your Mobile Measurement Partner (MMP). MMPS play a central role in any app’s marketing strategy, both for user acquisition and retention.
Key Takeaways
MMPs unify your data: They consolidate insights across paid, owned, and earned channels in one dashboard.
True performance visibility: Go beyond just installs by tracking cost per impression, click, install, and deeper engagement metrics.
Better budget allocation: Identify which channels deliver real value and optimise spend accordingly.
Unlock user insights: In-app event tracking shows not just where users come from, but what they do after downloading.
Essential for privacy-first marketing: MMPs help navigate iOS privacy changes and ensure accurate measurement.
Stay scalable: They simplify your tech stack, replacing multiple SDKs with a single, integrated solution.
What is an MMP?
App marketers typically run user acquisition (UA) campaigns across multiple platforms and channels, including:
Paid – Meta, Google, Snapchat, TikTok, Apple Search Ads, etc.
Owned – Website, blog, email
Earned – App reviews in independent magazines and review sites
Source: Apple Search Ads
All this activity should lead to people downloading and installing your app, all of which is great, but also meaningless if you can’t track which activity generated each download. And in today’s privacy-first ecosystem, that visibility is harder to achieve than ever. With Apple and Google limiting user-level tracking, attribution can feel like a black-box.
An MMP helps you cut through the complexity by attributing, collecting, and organizing app data in a privacy-first way, delivering a unified view of campaign performance across channels, media sources, and ad networks. It gives you this visibility of which channels are performing, and which aren’t.
For each channel, it will deliver metrics such as:
Cost per impression
Cost per click
Cost per install
Cost per acquisition
These insights enable you to optimise your marketing spend towards the best-performing channels so that you can scale up your UA activities most efficiently. This is particularly important when you consider that app user acquisition costs have increased by 60% in the last five years, reaching an average of $29 per user in 2024, according to research from SimplicityDX, reported by Business of Apps. Understanding where your budget delivers the best results is essential for staying competitive.
But it doesn’t stop at downloads. The data MMPs generate enables you to dig deeper into the value of each install by looking at what happens “down-funnel” by setting up in-app events.
Use In-App Events to Generate Valuable Insights from your MMP
In-app events allow you to track what users do in the app after installing it. Each event is a key conversion point in the user’s journey through the app. They will differ depending on the type of app, but will typically include things like:
User registration
Newsletter sign up
Clicks on a push notification
Makes a purchase
Join your loyalty program
You can set up the in-app events that are most relevant to your app and most useful in understanding the value of each user. Your MMP then enables you to track these back to where the install came from. This might reveal, for example, that Meta generates twice as many installs as Apple Search Ads, but that the users who install after clicking on an Apple Search Ads spend three times more in the app than those who came in via Meta.
Simplified Reporting in one Dashboard
An MMPdelivers all these insights in one unified dashboard, across all the platforms you use to find new users. It’s a far easier way to get a consolidated, real-time view of what’s happening. Even if you’re only active in one or two channels, the insights an MMP delivers into things like Customer Lifetime Value, churn, and conversion against the in-app events you set up far exceed what each platform will typically offer in terms of reporting.
The Benefits of Using an MMP
In summary, the key benefits of using an MMP are:
Unified reporting across all platforms in one dashboard
Granular insights into cost per impression/click/install, customer lifetime value, churn, conversion in in-app events
Insights that enable you to optimise your marketing spend and better allocate your budget.
Why Skipping an MMP is a Risky Move
Falling Behind in Privacy Compliance With iOS privacy updates transforming the landscape, MMPs are critical for adapting to new tracking systems and ensuring accurate data collection. They provide the agility needed to stay ahead in a rapidly changing privacy environment.
Misleading Performance Data Without an MMP, you’re forced to rely on self-attribution from platforms like Google, which often overinflate their numbers. We’ve seen examples of platforms over-reporting key metrics like installs, leading to inaccurate performance insights. This kind of misreporting can lead to budget misallocation and misguided strategy decisions.
Missing out on Critical Insights MMPs allow you to measure and optimise performance beyond just installs, providing a more comprehensive view of user behavior and value. Leveraging MMP data can reveal that a lower CPI doesn’t always translate to higher-quality users. By analyzing the relationship between CPI and downstream metrics like trial start rates, marketers can refine their bidding strategies to drive better results. Without an MMP, such nuanced insights, and the resulting optimizations, wouldn’t have been possible.
Overcomplicating your Tech Stack Skipping an MMP requires integrating multiple SDKs, such as Meta, which not only complicates the setup but also raises significant data and privacy concerns.
Setting up your MMP for Success: Best Practices
Most of the main MMP providers will have integrations across your tech stack, but this is a point worth checking with them when you are assessing providers. If the MMP is integrated across your tech stack, it will be easier to set everything up and gain the insights that will feed your app’s success. For example, if you have already set up in-app events in an in-app analytics tool such as Mixpanel, these can be carried across to the MMP platform to avoid duplicating effort.
1. Define the In-App Events to Optimize Towards
The first step to maximizing the investment in your MMP is to define the in-app events you want to track.The chosen events should reflect meaningful interactions that signal user engagement or progression toward higher-value actions. It’s vital to define these events, not only to monitor when and how frequently they occur, but also to optimise your user acquisition campaigns to align with each funnel stage. Once the user completes an event, i.e.., installs or registers, the point of optimization within the campaigns may change to encouraging conversion to purchase, for example.
2. How many In-App Events should I Track?
It’s not possible, or even desirable, to track everything that happens in your app. We normally recommend around 5-10 in-app events. These should be the key points you want users to convert against, and the ones you can optimise your campaigns towards. Events should describe an action a user takes and should be a combination of a verb and noun, for example:
Registration Completed
Watched Video
Product Page Viewed
Purchase Completed
Subscription Purchase Completed
Event names should be easy to read and not overly descriptive. Upper/lower casing is supported, and it is recommended that the verb should be in the past tense (see the example below).
Once you have defined the in-app events, create a tracking plan that details the naming convention for each event (e.g. subscription purchase completed); the point where it triggers (once a user selects the ‘confirm payment’ button on the billing page); and any parameters that provide more detail on that event (e.g., ‘monthly’, signaling that it is the monthly subscription they’ve purchased), then pass that onto your developers to in build as part of the SDK setup. Now you’re ready for testing.
3. Test Everything to Ensure Success
Testing is vital to ensure that your app behaves as it should and that the in-app events are triggered correctly. Once the in-app events are set up, set up an app testing account to simulate the potential user journey and ensure the events show within the MMP testing environment. Use this account to complete each in-app event, ensuring that:
The events are triggered at the appropriate points
The tracking is functioning properly
The data returned is accurate and reliable.
How to Choose the Right MMP to Boost your App’s Growth
Choosing the right MMP to work with is all about finding one that is best aligned with your needs and expectations. Choosing the best mobile attribution platform is a detailed process, but essentially this breaks down into four key areas:
Cost and scalability – When allocating your budget for an MMP, you need to look at the bigger picture. As you expand your marketing efforts using an MMP, the associated costs are likely to rise, not just from increased spending on channels but also due to the higher volume of reported conversions within the platform. Remember to evaluate these costs and ensure they remain within your budget as your campaigns grow.
Functionality – Ask yourself, does the MMP do everything you need it to do? For example, does it provide a holistic view across multiple traffic sources and in terms of the granularity of data you require to understand each channel’s performance? Or, can it show you how much it’s costing you to acquire a click and a conversion?
Support level provided – Are you looking/able to run everything on the MMP platform yourself, or do you need the support of a managed service? Consider the level of support the MMP offers, especially for troubleshooting setup challenges or addressing questions about the data displayed in the platform.
Tech stack integration – Consider what level of integration the MMP offers with your existing tech stack, including in-app analytics tools, CRM tools, and DMPs (Data Management Platforms), and any other tools that you rely on to market and sustain your app.
Final Word: Making the Smart Choice
Even the best app needs a constant influx of new users to replace those who churn and deeper engagement with loyal users. Your MMP is key to achieving this, offering a unified view of marketing performance across platforms. It reveals how many installs each platform drives, their cost, and long-term value. Without an MMP, you’re marketing blind as ASO’s future rapidly evolves.